Wiretap
Self-hosted application inspector and monitoring platform for Laravel: traces, queries, jobs, mail and uptime in one place.

Version 0.1.0, the first public release. It is early: expect rough edges and breaking changes before 1.0. Issues and ideas are welcome on GitHub.
Quick start
Run the server:
docker run -d --name wiretap \
  -p 8080:8080 -p 9090:9090 -p 1025:1025 \
  -v wiretap_data:/data \
  ghcr.io/axvilab/wiretap
Install the package in your Laravel app:
composer require axvi/wiretap-laravel
Switch it on in .env:
WIRETAP_ENABLED=true
WIRETAP_URL=http://localhost:9090/ingest
Open http://localhost:8080 and make a request to your app. Set WIRETAP_PASSWORD on the server before you put it anywhere other people can reach.
There are many excellent tools in the Laravel ecosystem: Telescope, Pulse, Horizon, Ray, Clockwork, Flare, Mailpit, Oh Dear. They are well designed and battle-tested. But sometimes you want everything in one place, on your own server. Wiretap is that place: one Docker image that inspects what your application does and watches that it stays up.
How it works
Laravel app                              Wiretap
+----------------------+   HTTP / Redis  +--------------------------------+
| wiretap-laravel      | --------------> | :9090  ingest API              |
| (event collector)    |      gzip       | :8080  web UI (Vue 3, embedded) |
|                      | ---- SMTP ----> | :1025  SMTP server             |
+----------------------+                 | DuckDB (embedded, columnar)    |
                                         +--------------------------------+
There are two parts:
- The server: one Docker image with the receiver, DuckDB storage, the analyzer, a REST API, the web UI, an SMTP server, monitoring and notifications.
- The Laravel package: a lightweight event collector for Laravel 12 and 13 with auto-discovery and no required configuration.
Application inspection
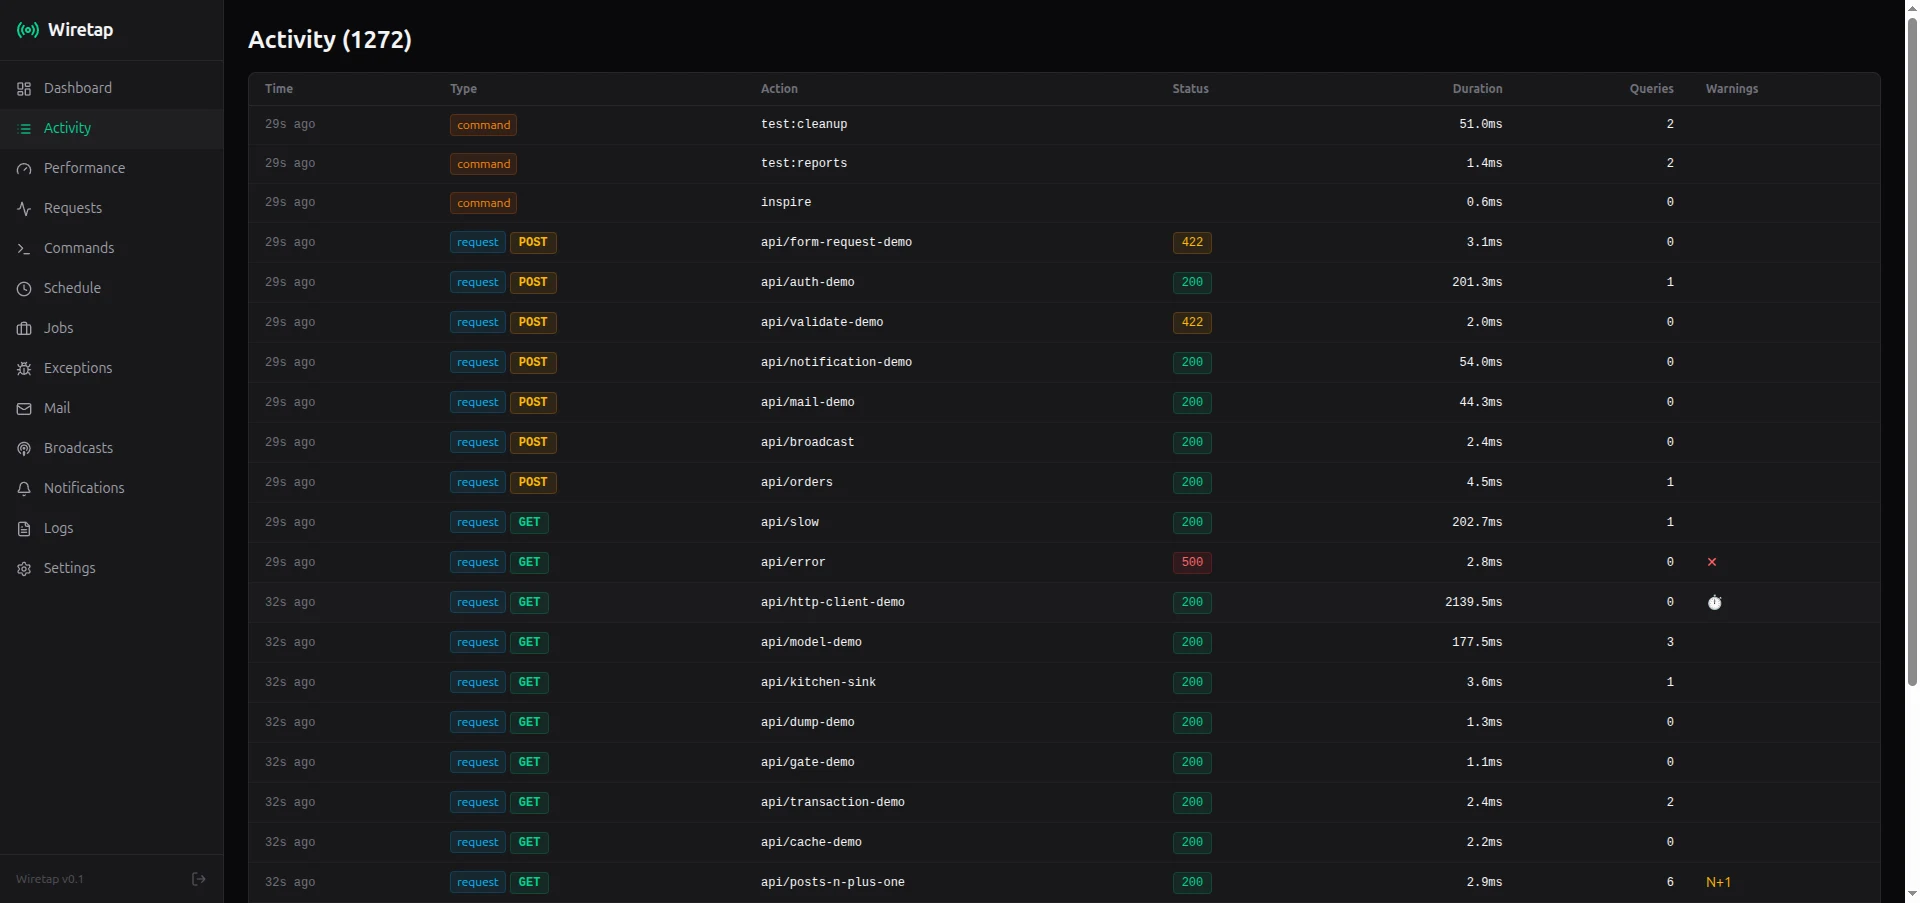
Wiretap captures 18 kinds of events: requests, database queries, exceptions, queue jobs, mail, cache operations, notifications, outgoing HTTP calls, auth events, artisan commands, scheduled tasks, gate and policy checks, dump() calls, validation errors, transactions, broadcast events, model events and rendered views. Each listener has its own config section: turn it on or off, ignore patterns with wildcards, and choose which data is stored.
Trace tree
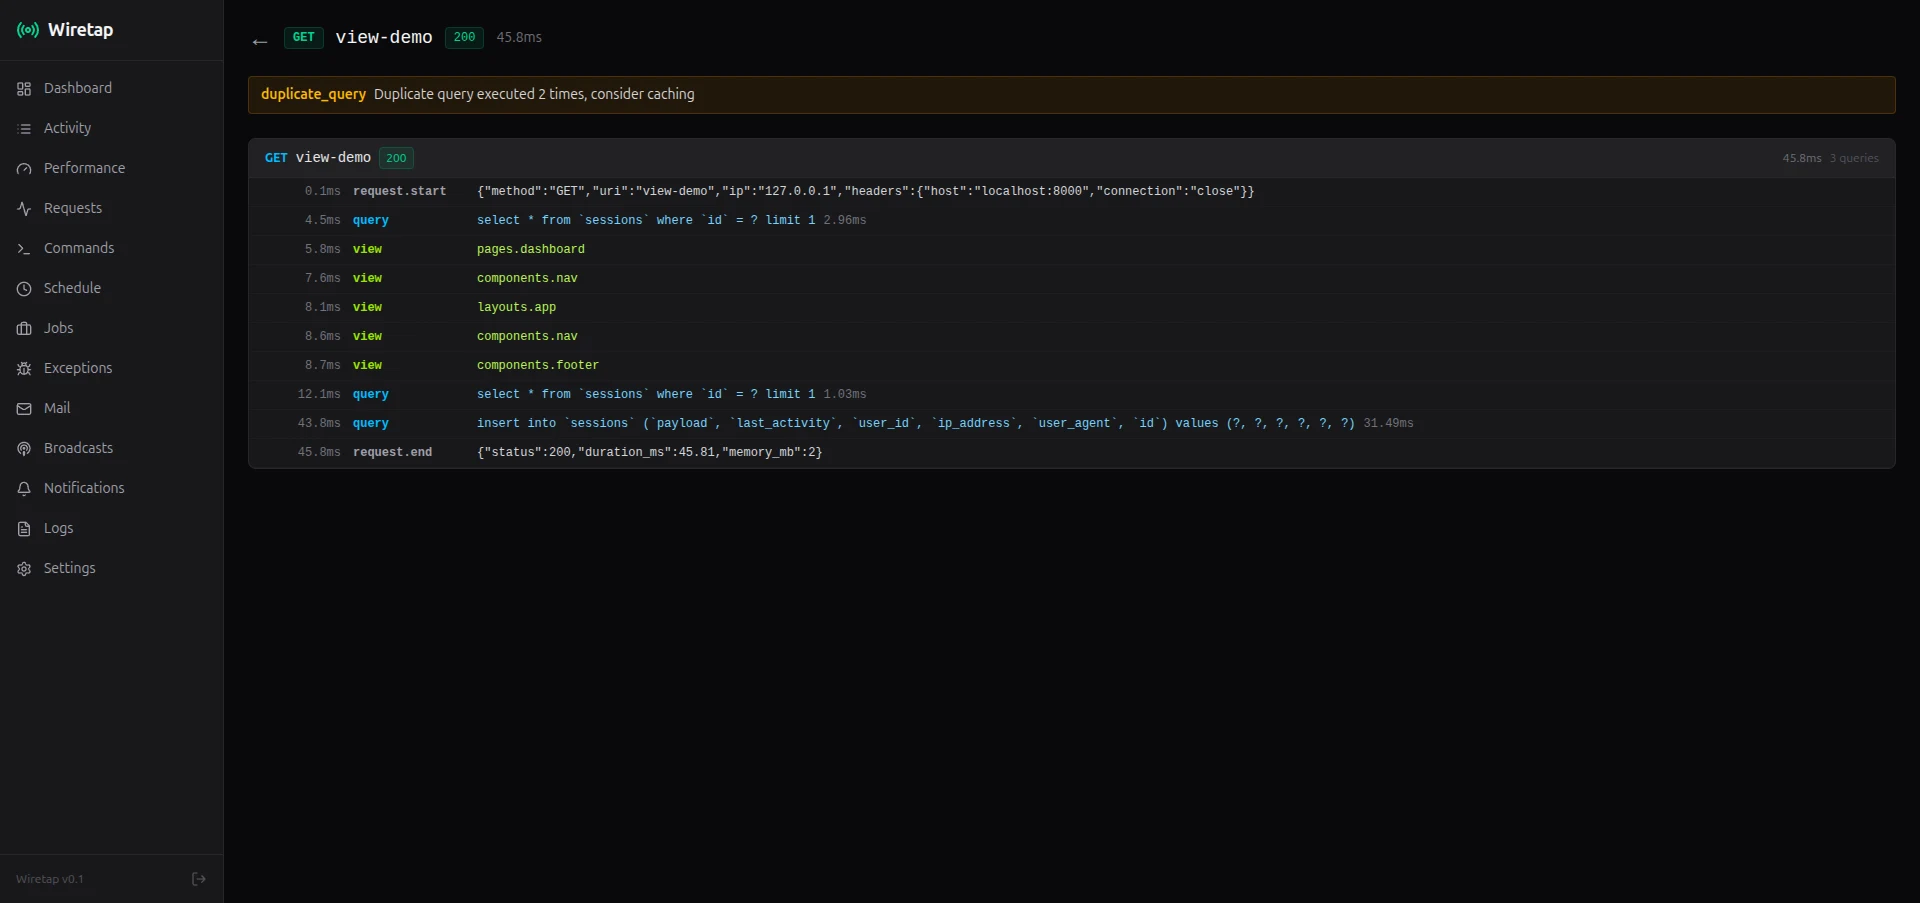
Every request, job, command and scheduled task produces a trace: a tree of everything that happened while it ran. You see which queries ran, what was cached, which jobs were dispatched and which emails were sent, in order and with timings.
N+1 and slow query detection
Every request is analysed automatically for N+1 patterns, duplicate queries and slow queries. Warnings show up in the request list and in the trace tree, and the thresholds are set on the Settings page.
The wiretap() helper
A silent debug function: values appear only in the Wiretap UI and never in your application output.
wiretap($variable);                    // inspect in the UI
wiretap($order->total, 'order total'); // with a label
$user = wiretap(User::find(1));        // inline, returns the value
Replay and retry
Replay HTTP requests, retry failed jobs, dispatch a job again with an edited payload, replay broadcasts and re-run artisan commands, all from the UI.
Wiretap handles email in two ways, and both work at the same time:
- As a development SMTP stub. Point
MAIL_HOSTandMAIL_PORTat Wiretap and no email reaches a real recipient. You read the HTML and text bodies and download attachments in the UI. - With any other mail driver. With Postmark, SES, Mailgun or production SMTP, emails are delivered as usual, and Wiretap still logs the content of every one.
Performance
- Top 10 slow endpoints: hits, average, P95 and maximum response time.
- Top 10 slow queries: the SQL, its execution time and a link to the trace.
- Dashboard: request and error timelines, response time trends (average and P95) and status code distribution, for periods from one minute to seven days.
Site monitoring
Useful when one project has several services (frontend, backend, API, admin panel) and you want to watch all of them from one place.
- Uptime checks: HTTP checks at intervals from 5 seconds, with Bearer, Basic, header or query parameter authentication. Tracks status codes, response times and uptime percentage.
- SSL certificates: hourly TLS checks with issuer, expiry date and days remaining; warns 14 days before expiry by default.
- Domain expiry: daily WHOIS lookups; warns when a domain expires within 30 days.
- Health endpoints: polled every 30 seconds; understands the Spatie Health format and generic JSON.
- Schedule heartbeats: expects a scheduled task to report within an interval or at a time of day, and alerts when a run is missed.
Notifications
Alerts go to Telegram, Slack or Microsoft Teams through webhooks. Rules have a configurable cooldown and cover exceptions, a site going down, SSL and domain expiry and a missed scheduled task. Every sent alert is kept in a log.
Security
- Password-protected web UI with HttpOnly session cookies.
- Ingest API key authentication.
- Origin-specific CORS, not a wildcard.
- Rate limiting on write requests and body size limits.
- Recursive, case-insensitive masking of sensitive fields.
Tech stack
- Go for the server, storage, SMTP, WebSocket updates and monitoring.
- Vue 3 and TypeScript for the embedded UI, with Tailwind CSS and ECharts.
- DuckDB as the embedded columnar database.
- PHP 8.2+ and Laravel 12 or 13 for the event collector package.